Choose the story that best describes the graph. 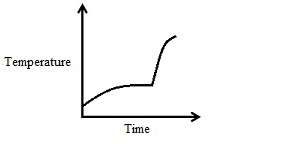
A) A frozen chicken was removed from the freezer and left to thaw until it reached room temperature. The chicken was then left out for another hour before it was placed in the oven to bake for an hour.
B) A frozen chicken was removed from the freezer and left to thaw. It was then placed in the oven to bake for an hour.
C) A frozen chicken was placed in the oven to bake. It was then removed from the oven and left on the counter for an hour. It was placed back in the oven to cook for another hour.
D) A frosen chicken was removed from the freezer and placed ina microwave oven to thaw quickly. The chicken was then left out for another hour before it was placed in the oven to bake for an hour.
E) A frozen chicken was placed in the oven to bake. It was then removed from the oven and left on the counter for an hour. It was placed back in a microwave oven to cook for another half hour.
Correct Answer:
Verified
Q59: Solve the following linear inequality.
Q60: 8 adults and 4 children need to
Q61: A store manager uses a markup rate
Q62: Jack and Jill run a catering business.
Q63: A small tumor in a patient begins
Q65: During a two -week period, there were
Q66: A runner begins running at a steady
Q67: Consider the graph below which depicts the
Q68: A population of bacteria grown in a
Q69: Which of the following is an arithmetic
Unlock this Answer For Free Now!
View this answer and more for free by performing one of the following actions

Scan the QR code to install the App and get 2 free unlocks

Unlock quizzes for free by uploading documents