Given the distribution of grouped scores shown in the following table. 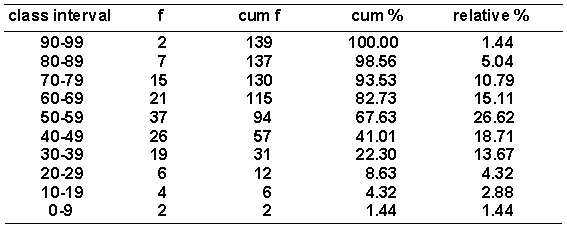 How many occurrences are there for the interval 60-69?
A) 115
B) 37
C) 15
D) 21
Correct Answer:
Verified
Q20: A researcher has collected some data on
Q21: Given the distribution of grouped scores shown
Q22: In graphing frequency distributions, _ is usually
Q23: What indicates the proportion of the total
Q24: What indicates the number of scores that
Q26: The purpose of a frequency distribution is
Q27: If i = 7, the scores are
Q28: The range of a set of scores
Q29: The true limits of 7.0 are _.
A)
Q30: Which of the following is (are) not
Unlock this Answer For Free Now!
View this answer and more for free by performing one of the following actions

Scan the QR code to install the App and get 2 free unlocks

Unlock quizzes for free by uploading documents