Multiple Choice
Which one of the following graphs represents the function  ?
?
A) 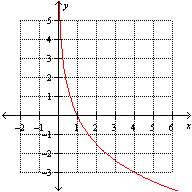
B) 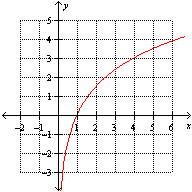
C) 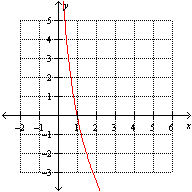
D) None of these options
E) 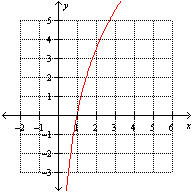
Correct Answer:
Verified
Related Questions
Q34: Use the Laws of Exponents to expand
Q35: Which one of the following is the
Q36: Which one of the following is the
Q38: The graph of a logarithmic function
Q39: On August 18 2009 a 6.3 magnitude
Q40: Convert the function Q44: Solve the logarithmic equation Q52: If $18000 is invested at an interest Q53: If $16000 is invested at an interest Q60: On August 21 2009 the World Health![]()
![]()
Unlock this Answer For Free Now!
View this answer and more for free by performing one of the following actions

Scan the QR code to install the App and get 2 free unlocks

Unlock quizzes for free by uploading documents