Multiple Choice
Which one of the following graphs represents the function  ?
?
A) 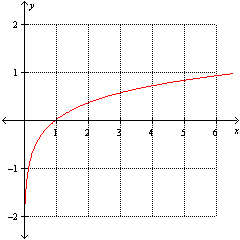
B) 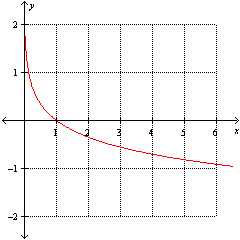
C) 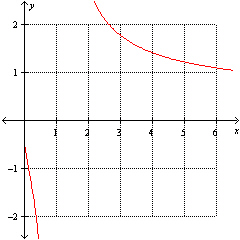
D) None of these options
E) 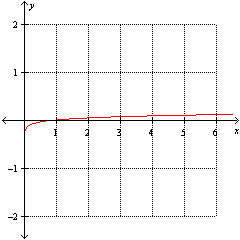
Correct Answer:
Verified
Related Questions
Q24: Fill in the blank.
A magnitude 8 earthquake
Q25: The initial size of a population is
Q26: Which one of the following is the
Q27: If we know the amount of light
Unlock this Answer For Free Now!
View this answer and more for free by performing one of the following actions

Scan the QR code to install the App and get 2 free unlocks

Unlock quizzes for free by uploading documents