Essay
A patient was administered Iodine-123 before a thyroid imaging scan. The table illustrates the data gathered over a 12-hour time period.
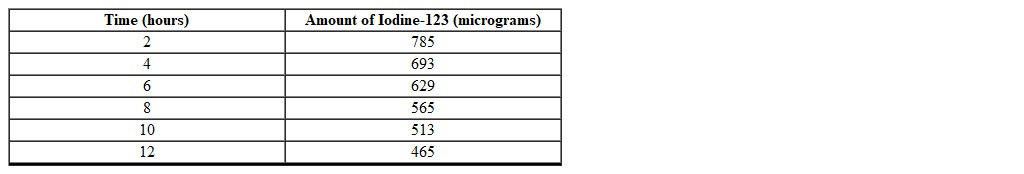
Using a graphing calculator, find an appropriate curve that models the amount of Iodine-123 (in micrograms) as a function of the time (in hours) (round to the nearest thousandth).
Correct Answer:
Verified
Related Questions
Q96: Using the following table, find the average
Q97: What is the domain of the exponential
Q98: What is the percentage rate of change
Q99: Using the following table of a function
Unlock this Answer For Free Now!
View this answer and more for free by performing one of the following actions

Scan the QR code to install the App and get 2 free unlocks

Unlock quizzes for free by uploading documents