Multiple Choice
Using the graph below, find the percentage rate of change from  to
to  .
. 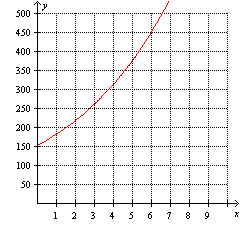
A) 4,026.0%
B) 51.8%
C) 311.0%
D) 150.0%
E) 107.4%
Correct Answer:
Verified
Related Questions
Q84: Using the graph below, find the average
Q85: Using the following table of a function
Q86: The population of Arizona was 4.2 million
Q87: Using the following table, find the percentage
Q88: What type of function does the data
Q90: The function Q91: What is the range of the exponential Q92: The population of Arizona was 5.1 million Q93: What type of function does the data Q94: The function ![]()
![]()
Unlock this Answer For Free Now!
View this answer and more for free by performing one of the following actions

Scan the QR code to install the App and get 2 free unlocks

Unlock quizzes for free by uploading documents