Solved

The Owner of a Gas Station Records the Number of Gallons

Question 2

Multiple Choice

The owner of a gas station records the number of gallons of gas he sells over a period of time. He notices that the number of gallons of gas he sells depends linearly on the price he charges for each gallon. When he charges $1.96 per gallon of gas, he sells 800 gallons of gas each day. When he charges $2.65 per gallon, he sells 400 gallons. Which one of the following graphs illustrate this situation?


A) None of these options
B) The owner of a gas station records the number of gallons of gas he sells over a period of time. He notices that the number of gallons of gas he sells depends linearly on the price he charges for each gallon. When he charges $1.96 per gallon of gas, he sells 800 gallons of gas each day. When he charges $2.65 per gallon, he sells 400 gallons. Which one of the following graphs illustrate this situation? A)  None of these options B)    C)    D)    E)
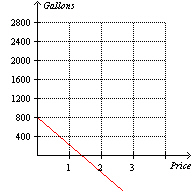
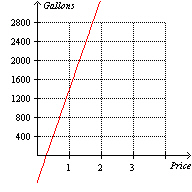
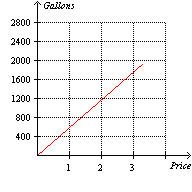
C) The owner of a gas station records the number of gallons of gas he sells over a period of time. He notices that the number of gallons of gas he sells depends linearly on the price he charges for each gallon. When he charges $1.96 per gallon of gas, he sells 800 gallons of gas each day. When he charges $2.65 per gallon, he sells 400 gallons. Which one of the following graphs illustrate this situation? A)  None of these options B)    C)    D)    E)
D) The owner of a gas station records the number of gallons of gas he sells over a period of time. He notices that the number of gallons of gas he sells depends linearly on the price he charges for each gallon. When he charges $1.96 per gallon of gas, he sells 800 gallons of gas each day. When he charges $2.65 per gallon, he sells 400 gallons. Which one of the following graphs illustrate this situation? A)  None of these options B)    C)    D)    E)
E) The owner of a gas station records the number of gallons of gas he sells over a period of time. He notices that the number of gallons of gas he sells depends linearly on the price he charges for each gallon. When he charges $1.96 per gallon of gas, he sells 800 gallons of gas each day. When he charges $2.65 per gallon, he sells 400 gallons. Which one of the following graphs illustrate this situation? A)  None of these options B)    C)    D)    E)

Correct Answer:

verifed

Verified

Related Questions

Unlock this Answer For Free Now!

View this answer and more for free by performing one of the following actions

qr-code

Scan the QR code to install the App and get 2 free unlocks

upload documents

Unlock quizzes for free by uploading documents