Multiple Choice
A population of rabbits was tracked over a 55-day period. The data is shown in the following graph. What was the approximate number of rabbits on day 30? 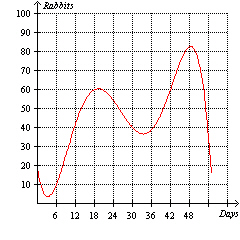
A) 40
B) 15
C) 10
D) 30
E) 83
Correct Answer:
Verified
Related Questions
Q63: For the function Q64: For the function Q65: Which of the following formulas express the Q66: The table below shows the salary values Q67: Does the equation 3 x - 5 Q69: Solve the equation Q70: The amount of an investment A after Q71: The graphs of Q72: Does the equation x = ( y Q73: Given the table below, is the variable Unlock this Answer For Free Now! View this answer and more for free by performing one of the following actions Scan the QR code to install the App and get 2 free unlocks Unlock quizzes for free by uploading documents![]()
![]()
![]()
![]()

