A population of rabbits was tracked over a 55-day period. The data is shown in the following graph. How did the population of rabbits change between day 3 and day 20? 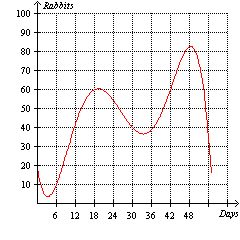
A) The population of rabbits increased from approximately 5 rabbits to 83 rabbits.
B) The population of rabbits decreased from approximately 83 rabbits to 5 rabbits.
C) The population of rabbits increased from approximately 5 rabbits to 61 rabbits.
D) The population of rabbits was constant during this time period.
E) The population of rabbits decreased from approximately 61 rabbits to 5 rabbits.
Correct Answer:
Verified
Q49: Let f(x) = 3 x 
Q50: The temperature (in ° F) of a
Q51: Use the following graph to create an
Q52: Which one of the following best describes
Q53: A membership to a local fitness club
Q54: The verbal description below can be represented
Q55: A membership to a local fitness club
Q56: The distance d (in miles) that a
Q57: The cost of college tuition for 12
Q59: Which one of the following represents the
Unlock this Answer For Free Now!
View this answer and more for free by performing one of the following actions

Scan the QR code to install the App and get 2 free unlocks

Unlock quizzes for free by uploading documents