Which one of the following models the data graphed in the scatter plot. 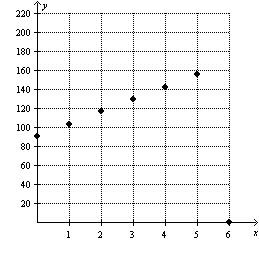
A) 
B) 
C) 
D) 
E) 
Correct Answer:
Verified
Q24: For the scatter plot below, which statement
Q25: Using the table below, determine the value
Q26: The following table shows the values of
Q27: The number of gallons of water remaining
Q28: The number of gallons of water remaining
Q30: Find the domain and range of the
Q31: The table below describes the average temperatures
Q32: The mass of bacteria (in micrograms) in
Q34: The value V of a historic vehicle
Q34: The table below describes the average temperatures
Unlock this Answer For Free Now!
View this answer and more for free by performing one of the following actions

Scan the QR code to install the App and get 2 free unlocks

Unlock quizzes for free by uploading documents