Short Answer
You have moved to Chicago in the fall. The graph shows the average monthly high temperature for months since you moved to Chicago. If a quadratic model  is fit to the graphed data set will a be positive or negative?
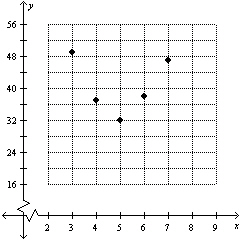
Correct Answer:
Verified
Related Questions
Q57: The graph shows the average monthly high
Q58: A _ model fits data points that
Q59: Given the data set draw a scatterplot.
Q60: The average profit in dollars A that
Unlock this Answer For Free Now!
View this answer and more for free by performing one of the following actions

Scan the QR code to install the App and get 2 free unlocks

Unlock quizzes for free by uploading documents