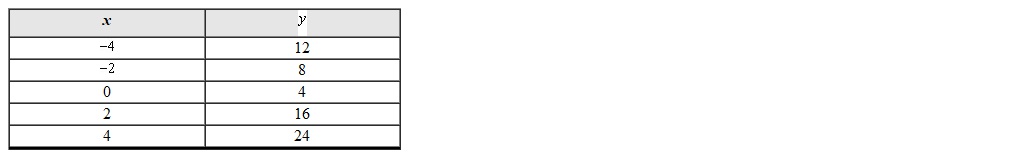
Given the data set draw a scatterplot. Clearly label and scale the axes. Are the data approximately linear?
Correct Answer:
Verified
Q26: The Supplemental Nutrition Assistance Program (SNAP) to
Q27: The Supplemental Nutrition Assistance Program (SNAP) to
Q28: The Supplemental Nutrition Assistance Program (SNAP) to
Q29: The Supplemental Nutrition Assistance Program (SNAP) to
Q30: The Supplemental Nutrition Assistance Program (SNAP) to
Q32: During the years 2002 to 2008 smoking
Q33: During the years 2002 to 2008 smoking
Q34: The population of the District of Columbia
Q35: The percentage P of 6 to 11
Q36: The percentage P of 6 to 11
Unlock this Answer For Free Now!
View this answer and more for free by performing one of the following actions

Scan the QR code to install the App and get 2 free unlocks

Unlock quizzes for free by uploading documents