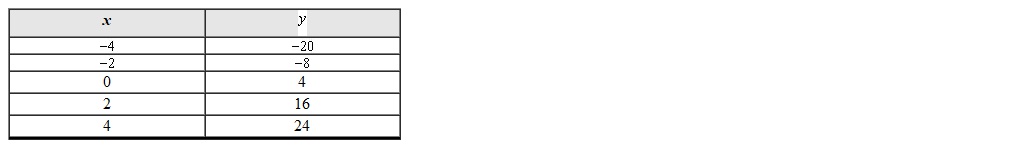
Given the data set draw a scatterplot. Clearly label and scale the axes. Are the data approximately linear?
Correct Answer:
Verified
View Answer
Unlock this answer now
Get Access to more Verified Answers free of charge
Q18: During the years 1994 to 2007 seat
Q19: The percentage of eighth grade students P
Q20: During the years 1994 to 2007 seat
Q21: The percentage P of 6 to 11
Q22: Given the data set draw a scatterplot.
Q24: The percentage P of 6 to 11
Q25: During the years 2002 to 2008 smoking
Q26: The Supplemental Nutrition Assistance Program (SNAP) to
Q27: The Supplemental Nutrition Assistance Program (SNAP) to
Q28: The Supplemental Nutrition Assistance Program (SNAP) to
Unlock this Answer For Free Now!
View this answer and more for free by performing one of the following actions

Scan the QR code to install the App and get 2 free unlocks

Unlock quizzes for free by uploading documents