During the years 1994 to 2007 seat belt use among front seat passengers ages 16 to 24 has increased. A linear model for the percentage of these passengers who use a seat belt is 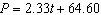 where P is percentage with a seat belt and t is years since 2000. The years before 2000 have a negative value for t. What is the slope of the model and what does it mean in terms of the problem?
A) 2.33. Every year seat belt use goes down 2.33.
B) 2.33. Every year seat belt use goes down 2.33%
C) 2.33. Every year seat belt use goes up 2.33%
D) 64.60. Seat belt use started at 64.60%
Correct Answer:
Verified
Q1: During the years 1994 to 2007 seat
Q2: If the prediction of the output value
Q3: When you estimate an output value for
Q4: During the years 1994 to 2007 seat
Q5: Given the data set choose its scatterplot.
Q7: Decide which line fits the data best.
A)
Q8: Given the data set choose its scatterplot.
Q9: The _ for a linear data set
Q10: During the years 1994 to 2007 seat
Q11: Decide which line fits the data best.
A)
Unlock this Answer For Free Now!
View this answer and more for free by performing one of the following actions

Scan the QR code to install the App and get 2 free unlocks

Unlock quizzes for free by uploading documents