Data from local gas stations have revealed that gas prices decreased exponentially each week in late 2008. However there is debate over which model accurately describes the falling gas prices. Jim believes that the correct model for gas prices after x weeks is 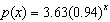 while April believes the model should be
 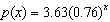 . What comparisons can be made about the two different models?
A) The gas prices decreased at a rate of 76% every week as opposed to 94% every week.
B) The gas prices decreased at a rate of 24% every week as opposed to 6% every week.
C) The price of the gas is $0.18 less than it was before.
D) The initial gas price decreased.
E) After x weeks the gas price is 0.76 times as much as the initial gas price instead of 0.94 times as much.
Correct Answer:
Verified
Q2: In 1990 a town's population was 21435.
Q3: The horizontal asymptote of the graph is
Q4: In 1990 a town s population was
Q5: The function Q6: The function Q8: The table can be modeled by where Q9: The average rate of change for the Q10: The percent rate of change for the Q11: The number of people infected with the Q12: The function Unlock this Answer For Free Now! View this answer and more for free by performing one of the following actions Scan the QR code to install the App and get 2 free unlocks Unlock quizzes for free by uploading documents![]()
![]()
![]()

