The owner of a gas station records the number of gallons of gas he sells over a period of time. He notices that the number of gallons of gas he sells depends linearly on the price he charges for each gallon. When he charges $1.96 per gallon of gas he sells 800 gallons of gas each day. When he charges $2.65 per gallon he sells 400 gallons. Which one of the following graphs illustrate this situation?
A) None of these options
B) 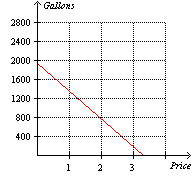
C) 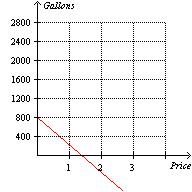
D) 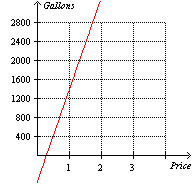
E) 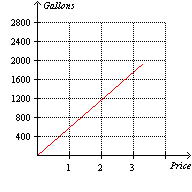
Correct Answer:
Verified
Q30: Using the following table of values determine
Q31: For the linear equation Q32: A beanstalk grows at a constant rate. Q33: Using the following graph find the slope Q34: Using the following table of values determine Q36: For the linear equation Q37: If Q38: For the linear equation Q39: The graph below shows distance as a Q40: For the linear equation Unlock this Answer For Free Now! View this answer and more for free by performing one of the following actions Scan the QR code to install the App and get 2 free unlocks Unlock quizzes for free by uploading documents![]()
![]()
![]()
![]()
![]()

