A small BBQ restaurant in Kansas City, Missouri sells three set meals during their lunchtime rush. They gather data and graph the percentage of orders at each type of meal set, as shown below.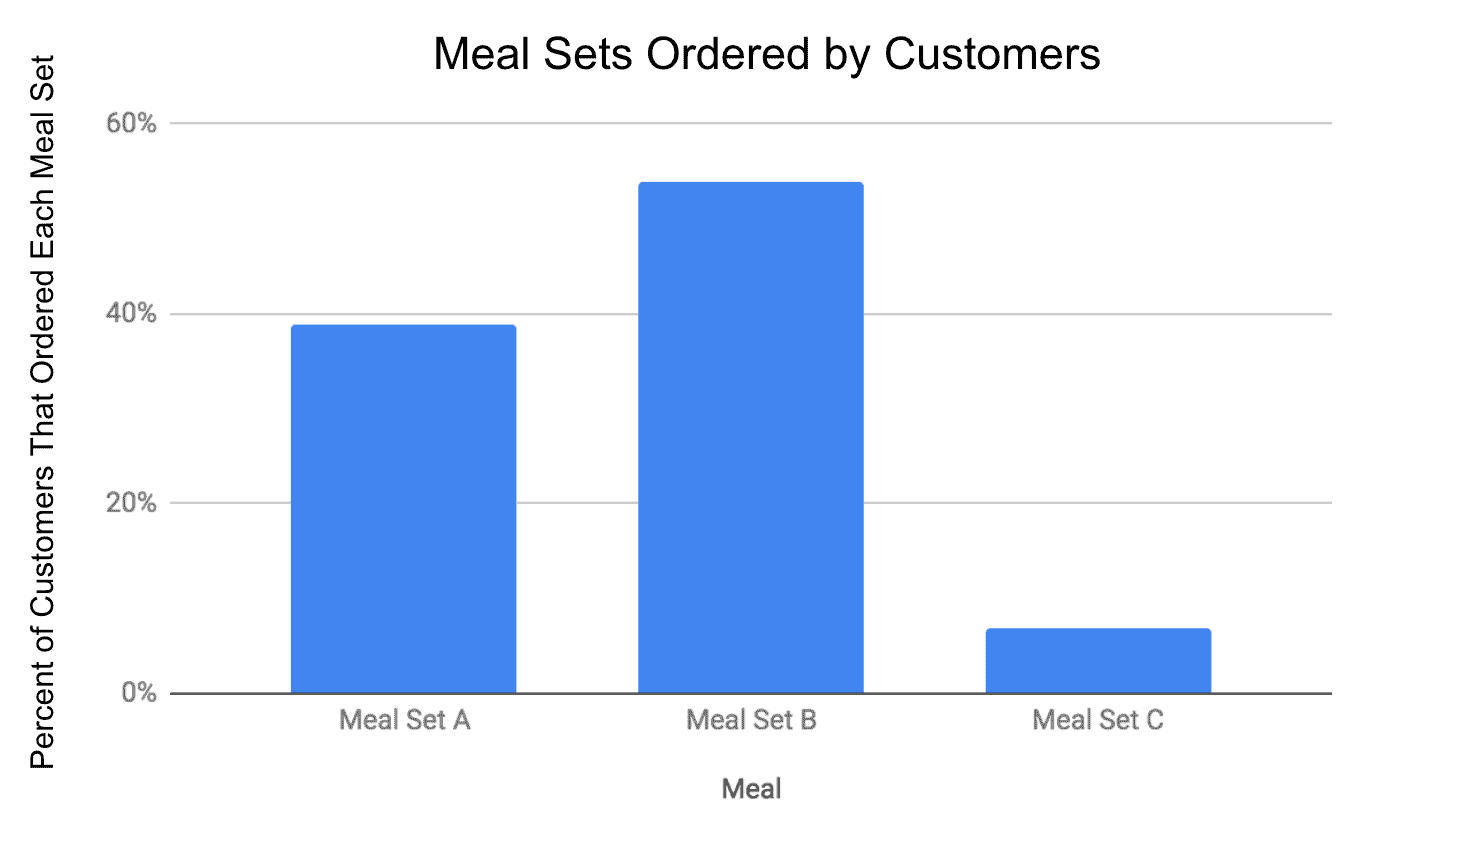 The reason the restaurant graphed the number of orders of each type of meal is because they are thinking of replacing one Meal Set (A, B, or C) with a different option. Which Meal Set should they replace?
A) Meal Set A
B) Meal Set B
C) Set A and B
D) Meal Set C
Correct Answer:
Verified
Q214: Simplify the expression:
4 - 1 1⁄3
A)2 5/6
B)2
Q215: Simplify the expression:
2 2⁄3 - 1 1⁄4
A)1
Q216: People were surveyed in 3 different Asian
Q217: The graph below shows the percentage of
Q218: People were surveyed in 3 different Asian
Q220: Simplify the expression:
2 7⁄10 - 3⁄4
A)1 19/20
B)39/40
Q221: 285 people were asked about their favorite
Q222: 285 people were asked about their favorite
Q223: A high school asked students which mode
Q224: A high school asked students which mode
Unlock this Answer For Free Now!
View this answer and more for free by performing one of the following actions

Scan the QR code to install the App and get 2 free unlocks

Unlock quizzes for free by uploading documents