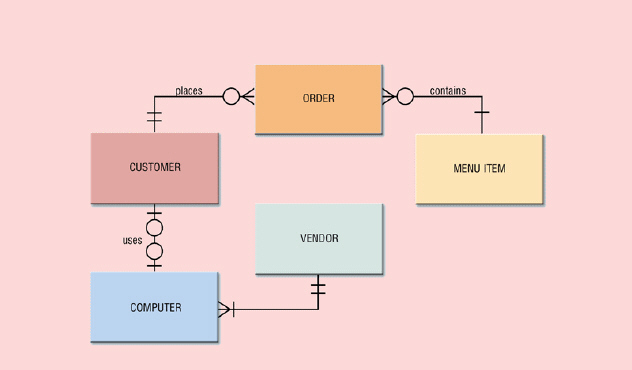
 Figure 12-2 A(n) ____________________, such as that pictured in Figure 12-2, is a tool that graphically shows the flow of data in a system.
Correct Answer:
Verified
View Answer
Unlock this answer now
Get Access to more Verified Answers free of charge
Q148: _ is the collection and summarization of
Q149: _ is a measure of how suitable
Q150: The _ is a set of activities
Q151: _ occurs when one activity in a
Q152: Project leaders should have good _ so
Q154: _ include anyone for whom an information
Q155: In large companies, users write a formal
Q156: _ are sets of rules and procedures
Q157: System development cycles often group many activities
Q158: A(n) _ is a set of components
Unlock this Answer For Free Now!
View this answer and more for free by performing one of the following actions

Scan the QR code to install the App and get 2 free unlocks

Unlock quizzes for free by uploading documents