The depth of a silicon wafer is targeted at 1.015 mm. If properly functioning, the process produces items with a mean of 1.015 mm and a standard deviation of ±0.004 A sample of 16 items is measured once each hour. The sample means for the past 12 hours are given in the table below. From the table of data, determine the most accurate mean control chart.
A) 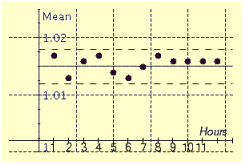
B) 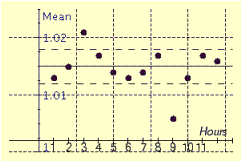
C) 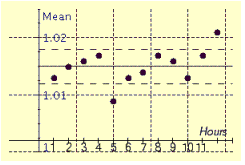
D) 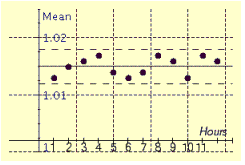
Correct Answer:
Verified
Q179: Consider the following bar graph. How many
Q180: Consider the following bar graph. How many
Q181: Consider the following bar graph. What country
Q182: Find the sample standard deviation from
Q183: Find the sample standard deviation from
Q185: Find the sample standard deviation from
Q186: A sporting goods manufacturer makes baseballs.
Q187: Find the sample standard deviation from
Q188: The illumination of a light bulb is
Q189: Find the sample standard deviation from
Unlock this Answer For Free Now!
View this answer and more for free by performing one of the following actions

Scan the QR code to install the App and get 2 free unlocks

Unlock quizzes for free by uploading documents