Multiple Choice
The illustration below lists the winning batting average for the years 1993 through 2000 in the major leagues. Draw a line graph for these data.
A) 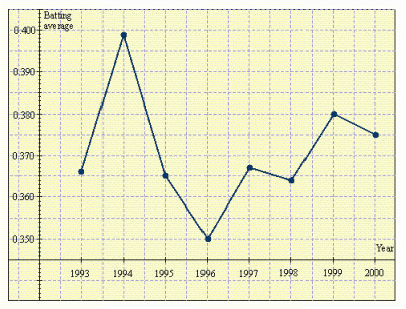
B) 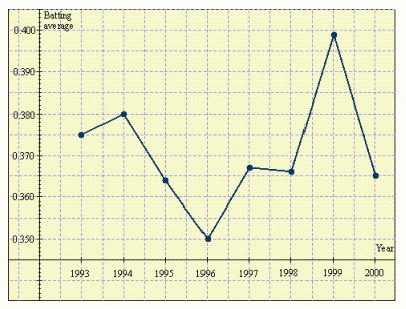
C) 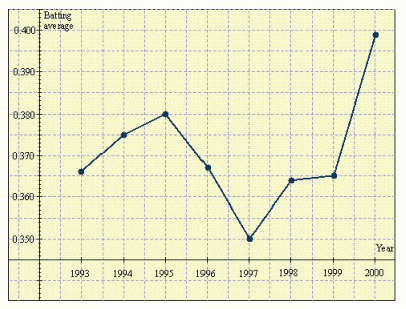
D) 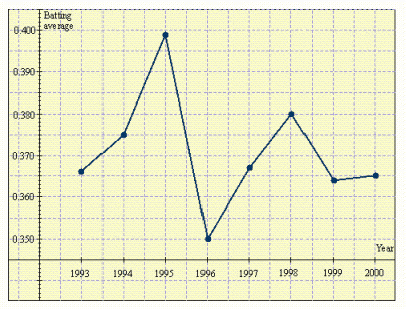
E) 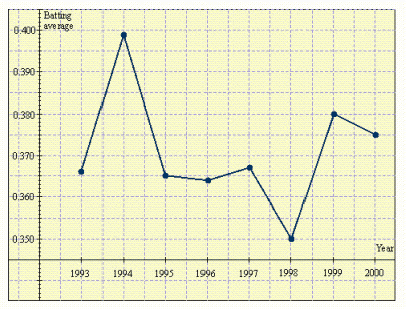
Correct Answer:
Verified
Related Questions
Unlock this Answer For Free Now!
View this answer and more for free by performing one of the following actions

Scan the QR code to install the App and get 2 free unlocks

Unlock quizzes for free by uploading documents