Draw a circle graph. In 1996, the values, in millions of dollars, of crop output for farms in the United States were as follows: food grains, 11,666
Food crops, 20,065
Cotton, 7,342
Oil crops, 17,703
Tobacco, 4,900
Fruits and tree nuts, 11,593
Vegetables, 14,491
All other, 15,737
A) 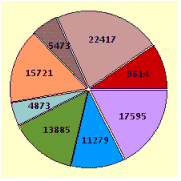
B) 
C) 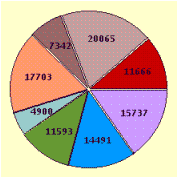
D) 
Correct Answer:
Verified
Q72: A card is chosen from a
Q73: A coin is tossed, and a
Q74: A bag contains 10 green marbles,
Q75: The 2022 projected population data for the
Q76: A card is drawn and replaced
Q78: Three out of ten motorcyclists wear
Q79: In 2000 the United States population by
Q80: Four dice are rolled. What is
Q81: Use the figure below to answer the
Q82: Use the frequency distribution to find
Unlock this Answer For Free Now!
View this answer and more for free by performing one of the following actions

Scan the QR code to install the App and get 2 free unlocks

Unlock quizzes for free by uploading documents