The following graph shows the relationship between a company s profits P and the number of items it sells x . ( P is in dollars.) What is their maximum profit? 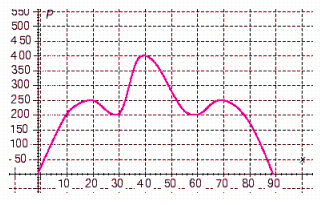
A) Their maximum profit is $250.
B) Their maximum profit is $200.
C) Their maximum profit is $325.
D) Their maximum profit is $800.
E) Their maximum profit is $400.
Correct Answer:
Verified
Q59: Find the equation of the line with
Q60: Line l is perpendicular to the graph
Q61: Hali is tossing a quarter into the
Q62: A rectangle is 6 inches longer than
Q63: A ball is thrown straight up into
Q65: Hali is tossing a quarter into the
Q66: Does the graph represent a function?
Q67: Does the graph represent a function?
Q68: Suppose you have a job that pays
Q69: The formula for the area 
Unlock this Answer For Free Now!
View this answer and more for free by performing one of the following actions

Scan the QR code to install the App and get 2 free unlocks

Unlock quizzes for free by uploading documents