For the figure below, find a system of inequalities that describes the shaded region. 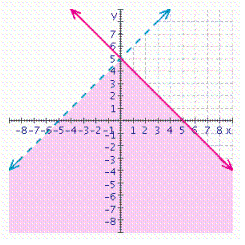
A) 
B) 
C) 
D) 
E) 
Correct Answer:
Verified
Q248: Graph the solution set for the system
Q249: Graph the solution set for the system
Q250: Find a system of inequalities describing the
Q251: Graph the solution set for the system
Q252: Graph the solution set for the system
Q254: Graph the solution set for the system
Q255: For the figure below, find a system
Q256: Graph the solution set for the system
Q257: Graph the solution set for the system
Q258: Graph the solution set for the system
Unlock this Answer For Free Now!
View this answer and more for free by performing one of the following actions

Scan the QR code to install the App and get 2 free unlocks

Unlock quizzes for free by uploading documents