Short Answer
In the graph below, name the linear inequality in two variables that is represented by the shaded region. 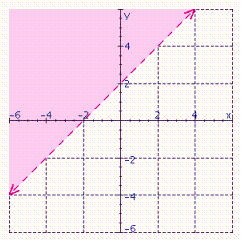
Correct Answer:
Verified
Related Questions
Q114: A dance club holds a maximum of
Q115: In the graph below, name the linear
In the graph below, name the linear inequality in two variables that is represented by the shaded region.
Correct Answer:
Verified
Q114: A dance club holds a maximum of
Q115: In the graph below, name the linear

