Multiple Choice
In the graph below, name the linear inequality in two variables that is represented by the shaded region. 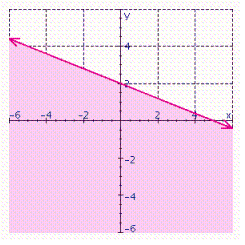
A) 
B) 
C) 
D) 
E) 
Correct Answer:
Verified
Related Questions
Q106: In the graph below, name the linear
Q107: In the graph below, name the linear
Q108: Graph the inequality. Q109: Graph the solution set. Q110: Graph the inequality. Q112: In the graph below, name the linear Q113: Graph the inequality. Q114: A dance club holds a maximum of Q115: In the graph below, name the linear Q116: Graph the solution set. Unlock this Answer For Free Now! View this answer and more for free by performing one of the following actions Scan the QR code to install the App and get 2 free unlocks Unlock quizzes for free by uploading documents![]()
![]()
![]()
![]()
![]()

