Multiple Choice
Which of the following illustrations best represents a bar graph?
A) 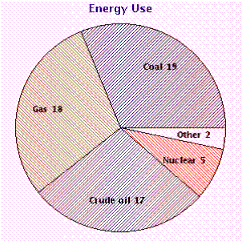
B) 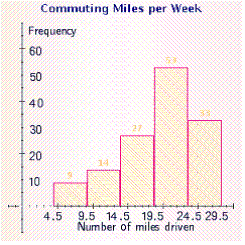
C) 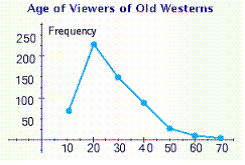
D) 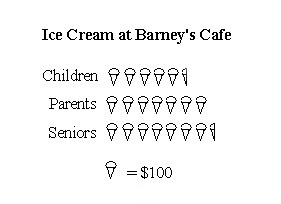
E) 
Correct Answer:
Verified
Related Questions
Q11: Refer to the pictograph.
How much more money
Q12: Refer to the line graph.
In approximately what
Q13: Which of the following illustrations represents a
Q14: Use the data in the table
Q15: Use the data in the table
Q17: Balls numbered from 1 to 38
Q18: Which of the following illustrations is a
Q19: To study the effect of fluoride in
Q20: How many more pet cats are there
Q21: Find the mean of the list of
Unlock this Answer For Free Now!
View this answer and more for free by performing one of the following actions

Scan the QR code to install the App and get 2 free unlocks

Unlock quizzes for free by uploading documents