The following graph shows how the value of the average car depreciates as a percent of its original value over a 10-year period. It also shows the yearly maintenance costs as a percent of the car s value. 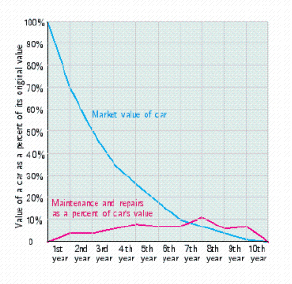 When is the car worth half of its purchase price?
At the end of the __________ year. When is the car worth 30% of its purchase price?
During the __________ year. When do the average yearly maintenance costs surpass the value of the car?
During the __________ year.
Correct Answer:
Verified
Q63: Q64: An initial deposit of $30,000 earns 12% Q65: To save for college, parents invest $20,000 Q66: Refer to the graph of Q67: Refer to the graph of Q69: An initial deposit of $30,000 earns 4% Q70: See the following graph. Q71: Refer to the graph of Q72: Find the db gain of an amplifier Q73: Solve for x . 
Unlock this Answer For Free Now!
View this answer and more for free by performing one of the following actions

Scan the QR code to install the App and get 2 free unlocks

Unlock quizzes for free by uploading documents