Annual U.S. imports from China in the years 2001-2002 could be approximated by 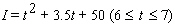 billion dollars per year, where
  represents time in years since the start of 1995. During the same period, annual U.S. exports to China could be approximated by
 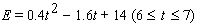 billion dollars per year. Compute the area between the graphs of
  and
and  over the interval
  .(Round your answer to the nearest $10 billion.)
A) $210 billion
B) $90 billion
C) $30 billion
D) $150 billion
E) $120 billion
Correct Answer:
Verified
Q27: Find the area of the region between
Q28: Find the area of the region enclosed
Q29: Find the average of the function
Q30: Find the area of the indicated region.
Q31: Find the average of the function
Q33: Suppose your annual income is 
Q34: Find the general solution of the differential
Q35: Find the area of the region between
Q36: Find the average of the function
Q37: Find the area of the indicated region.
Unlock this Answer For Free Now!
View this answer and more for free by performing one of the following actions

Scan the QR code to install the App and get 2 free unlocks

Unlock quizzes for free by uploading documents