The normal distribution curve which models, distributions of data in a wide range of applications, is given by the function 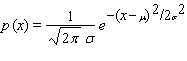 where
where  and
and  and
and  are constants called the standard deviation and the mean, respectively. Its graph is shown in the figure.
 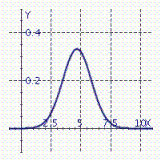 In a survey, consumers were asked to rate a new toothpaste on a scale of 1-10. The resulting data are modeled by a normal distribution with
  and
and  . The percentage of consumers who gave the toothpaste a score between a and b on the section is given by
  . Use a Riemann sum with n = 10 to estimate the percentage of customers who rated the toothpaste 4 or higher. (Use the range 3.5 to 10.5.)
A) 88%
B) 92%
C) 89%
D) 90%
E) 91%
Correct Answer:
Verified
Q53: Calculate the left Riemann sums for the
Q54: Use the given graph to estimate the
Q55: A model rocket has upward velocity
Q56: Calculate the left Riemann sum for the
Q57: Calculate the Riemann Sum for the integral
Q59: Calculate the Riemann Sum for the integral
Q60: The velocity of a particle moving in
Q61: Evaluate the integral. Q62: The oxygen consumption of a bird embryo Q63: Evaluate the integral. ![]()
![]()
Unlock this Answer For Free Now!
View this answer and more for free by performing one of the following actions

Scan the QR code to install the App and get 2 free unlocks

Unlock quizzes for free by uploading documents