Use the figure below to answer the following question(s) . Figure 4-9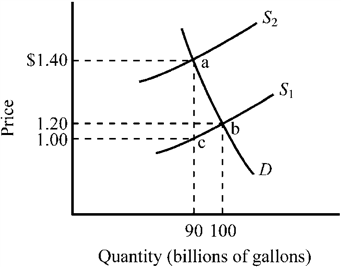 Refer to Figure 4-9. The market for gasoline was initially in equilibrium at point b and a $.40 excise tax is illustrated. What does the triangular area abc represent?
A) the revenue the government derives from the tax
B) the tax paid by consumers
C) the tax paid by producers
D) the deadweight loss (or excess burden) created by the tax
Correct Answer:
Verified
Q185: Use the figure below to answer the
Q186: Use the figure below to answer the
Q187: Use the figure below to answer the
Q188: Use the figure below to answer the
Q189: Use the figure below illustrating the impact
Q191: Use the figure below to answer the
Q192: Use the figure below to answer the
Q193: Use the figure below to answer the
Q194: Use the figure below to answer the
Q195: Use the figure below to answer the
Unlock this Answer For Free Now!
View this answer and more for free by performing one of the following actions

Scan the QR code to install the App and get 2 free unlocks

Unlock quizzes for free by uploading documents