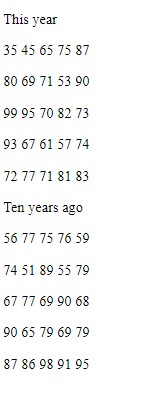
The scores below are from the same final exam given in a math class in two different years. Compute the mean and median (if necessary) and the range and standard deviation of these scores. Using these statistics, describe the differences in the two sets of scores.
Correct Answer:
Verified
Q27: When measures of central tendency and dispersion
Q28: If a distribution of scores has a
Q29: A graph used to visualize and analyze
Q30: Your score on the test is the
Q31: Which of the following data sets shows
Q32: Since the 1960s, the income associated with
Q34: Measures of variation indicate the degree to
Q35: Boxplots depict_.
A) central tendency.
B) dispersion.
C) both central
Q36: Some information about auto theft rates (number
Q37: The range (R) is found by subtracting
Unlock this Answer For Free Now!
View this answer and more for free by performing one of the following actions

Scan the QR code to install the App and get 2 free unlocks

Unlock quizzes for free by uploading documents