Exhibit 14-3 Aggregate supply and demand curves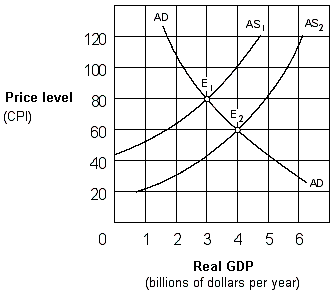
In Exhibit 14-3, the change in equilibrium from E1 to E2 represents:
A) deflation.
B) demand-pull inflation.
C) price-push inflation.
D) cost-push inflation.
Correct Answer:
Verified
Q72: The effect of an increase in aggregate
Q82: Lower taxes on businesses will shift the
Q84: How are demand-pull and cost-push inflation reflected
Q86: When OPEC caused the price of oil
Q87: Stagflation occurs when the economy experiences:
A) low
Q88: A reduction in regulation will shift the
Q93: The aggregate supply curve will shift to
Q126: Exhibit 14-4 Aggregate supply and demand curves
Q131: Exhibit 14-2 Aggregate supply and demand curves
Q136: _ inflation can be explained by a
Unlock this Answer For Free Now!
View this answer and more for free by performing one of the following actions

Scan the QR code to install the App and get 2 free unlocks

Unlock quizzes for free by uploading documents