Exhibit 14-7 Aggregate supply and demand curves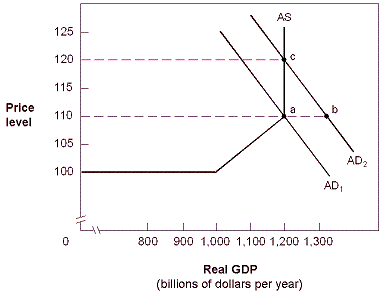
At point A in Exhibit 14-7, the aggregate demand AD2 and the aggregate supply curve reflect an economy in which
A) full employment is at $1,000 billion GDP.
B) excess aggregate supply is created when there is a shift from AD1 to AD2.
C) excess aggregate demand forces prices up to P = 120.
D) excess aggregate demand causes prices to stabilize at P = 110.
Correct Answer:
Verified
Q60: Given aggregate demand, a decrease in aggregate
Q62: Along the Keynesian range of the aggregate
Q66: Which of the following will most likely
Q70: Which of the following would cause a
Q76: The full employment level of real GDP
Q79: Suppose the economy is on the intermediate
Q107: Exhibit 14-7 Aggregate supply and demand curves
Q109: Exhibit 14-6 Aggregate supply curve Q110: Exhibit 14-8 Aggregate demand and supply Q112: Exhibit 14-4 Aggregate supply and demand curves![]()

Unlock this Answer For Free Now!
View this answer and more for free by performing one of the following actions

Scan the QR code to install the App and get 2 free unlocks

Unlock quizzes for free by uploading documents