Exhibit 3-4 Supply curves 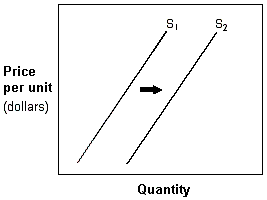
In Exhibit 3-4, which of the following could have caused the shift in the supply curve from S1 to S2?
A) Increase in demand.
B) Increase in materials cost.
C) Decrease in the number of suppliers in the market.
D) Decrease in wage rates.
Correct Answer:

Verified
Q121: Which of the following is most likely
Q122: Which of the following would not cause
Q126: The price of a good will fall
Q128: Which of the following is the least
Q131: A reduction in production costs will not
Q133: Assume Qs represents the quantity supplied at
Q134: A technological improvement in the production of
Q135: There is a technological advance in the
Q138: A shift occurs in the supply curve
Q140: A surplus of wheat:
A) is impossible if
Unlock this Answer For Free Now!
View this answer and more for free by performing one of the following actions

Scan the QR code to install the App and get 2 free unlocks

Unlock quizzes for free by uploading documents