Multiple Choice
Exhibit 1A-9 Multi-curve graph 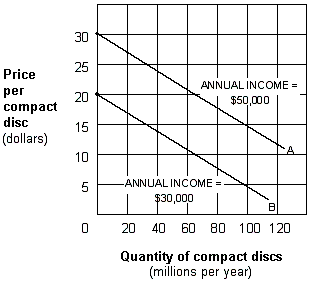
Exhibit 1A-9 represents a three-variable relationship. As the annual income of consumers falls from $50,000 (line A) to $30,000 (line B) , the result is a:
A) rightward movement along each curve.
B) leftward movement along each curve,.
C) leftward shift from curve A to curve B.
D) rightward shift from curve B to curve A.
Correct Answer:
Verified
Related Questions
Q4: Scarcity is a problem:
A) measured by the


