The table given below shows the values of different components of aggregate expenditure of an economy. The marginal propensity to consume (MPC) equals: 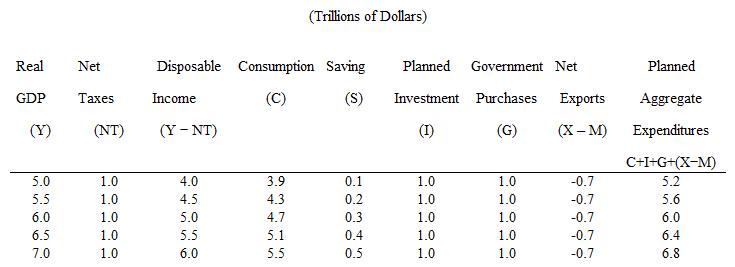
A) 0.20 or 1/5.
B) 0.40 or 2/5.
C) 0.80 or 4/5.
D) 0.90 or 9/10.
E) 0.60 or 3/5.
Correct Answer:
Verified
Q64: If planned spending exceeds planned output in
Q66: The table given below shows the values
Q67: The table given below shows the values
Q68: The figure given below shows the income-expenditure
Q68: The aggregate output demanded for a given
Q71: Which of the following best describes aggregate
Q72: The figure given below shows the income-expenditure
Q73: The table given below shows the values
Q78: If incomes in the United States increase,other
Q79: The aggregate expenditure line shows total planned
Unlock this Answer For Free Now!
View this answer and more for free by performing one of the following actions

Scan the QR code to install the App and get 2 free unlocks

Unlock quizzes for free by uploading documents