The movement from point A to point B in the figure below illustrates the effect of: 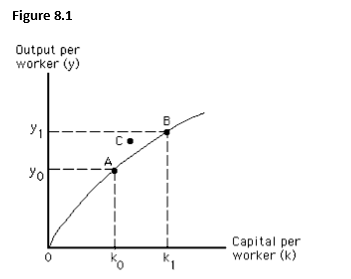
A) an increase in the capital stock relative to the workforce.
B) an increase in the labor productivity growth rate.
C) an increase in labor productivity because of higher quality capital.
D) a decrease in labor productivity.
E) a decrease in the capital stock.
Correct Answer:
Verified
Q5: The rules of the game refer to:
A)any
Q6: Suppose a production possibilities frontier (PPF)has been
Q8: The production possibilities frontier of an economy
Q13: Which of the following factors can influence
Q14: Productivity measures:
A)how efficiently resources are turned into
Q21: Joe runs a pizzeria at a busy
Q26: Which of the following factors of production
Q29: If a nation moves upward along its
Q31: An improvement in the quality of capital
Q40: The per-worker production function illustrates the fact
Unlock this Answer For Free Now!
View this answer and more for free by performing one of the following actions

Scan the QR code to install the App and get 2 free unlocks

Unlock quizzes for free by uploading documents