Figure 4.2 shows the demand curves for a good. A shift from demand curve D' to demand curve D in the figure below would be caused by a(n) :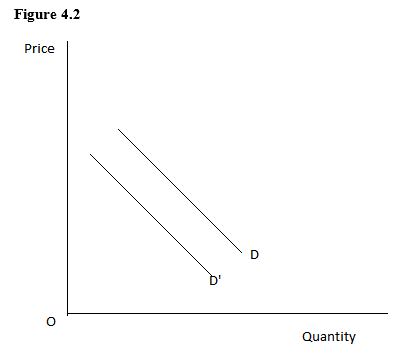
A) increase in the price of the good under consideration.
B) significant decrease in population because of emigration.
C) increase in the price of a substitute good.
D) decrease in the number of producers of the product.
E) decrease in the price of an important resource.
Correct Answer:

Verified
Q41: A change in money income of consumers
Q43: Which of the following best defines supply?
A)The
Q47: As the price of milk increases,producers are
Q51: Which of the following will lead to
Q55: Figure 4.2 shows the demand curves for
Q56: In the figure given below that shows
Q58: The market supply curve of a particular
Q63: Which of the following is likely to
Q72: Which of the following would shift the
Q74: If there is a shortage in the
Unlock this Answer For Free Now!
View this answer and more for free by performing one of the following actions

Scan the QR code to install the App and get 2 free unlocks

Unlock quizzes for free by uploading documents