The following figure shows the production possibilities frontier for Good A and Good B. In the figure below, point g is efficient because: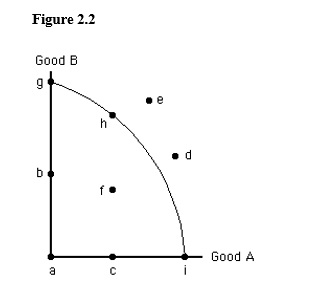
A) the only way to increase production of Good A is by decreasing production of Good B.
B) the economy can increase production of both Good A and Good B from point g.
C) it is impossible to move to any other point along the production possibilities frontier.
D) it is impossible to move to any other point inside the production possibilities frontier.
E) no other production possibilities frontier exists.
Correct Answer:
Verified
Q61: On a given production possibilities frontier,which of
Q76: An economy's production possibilities frontier:
A)helps explain the
Q77: The figure below shows the production possibilities
Q78: Which of the following is an example
Q80: In economics,specialization means:
A)producing something using only one
Q84: The figure given below shows the production
Q86: Any movement along a bowed-out production possibilities
Q88: A downward-sloping straight-line production possibilities frontier indicates:
A)that
Q122: Points outside the production possibilities frontier represent
A)unemployment
Q132: A production possibilities frontier will be bowed
Unlock this Answer For Free Now!
View this answer and more for free by performing one of the following actions

Scan the QR code to install the App and get 2 free unlocks

Unlock quizzes for free by uploading documents