The following figure shows the production possibilities frontier for Good A and Good B. In the figure below, point e represents: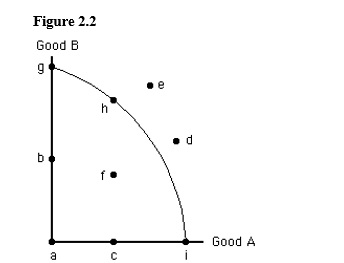
A) an attainable combination of Good A and Good B.
B) an unattainable combination of Good A and Good B.
C) the combination of Good A and Good B that the economy will produce.
D) one possible efficient combination of Good A and Good B.
E) the only unattainable combination of Good A and Good B.
Correct Answer:
Verified
Q63: The figure below shows the production possibilities
Q65: The figure below shows the production possibilities
Q66: When drawing a production possibilities frontier for
Q68: Points inside the production possibilities frontier represent:
A)full
Q69: The following figure shows the production possibilities
Q71: The figure below shows the production possibilities
Q75: Efficiency involves:
A)producing output using the least amount
Q79: Which of the following is measured along
Q101: If all resources are used efficiently to
Q109: A point outside the production possibilities frontier
A)represents
Unlock this Answer For Free Now!
View this answer and more for free by performing one of the following actions

Scan the QR code to install the App and get 2 free unlocks

Unlock quizzes for free by uploading documents