The figure given below depicts long-run equilibrium in the aggregate demand-aggregate supply model. The movement from Y1 to Y2 in this figure could have been caused by a: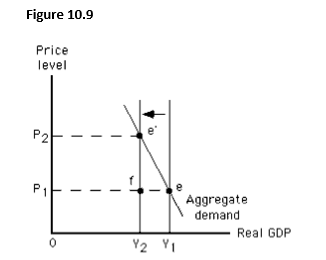
A) decrease in the size of the labor force.
B) decrease in the price level.
C) positive level of net investment.
D) increase in autonomous consumption.
E) decrease in autonomous consumption.
Correct Answer:
Verified
Q122: Wage rates are typically flexible upward but
Q124: The natural rate of unemployment includes frictional,cyclical,and
Q130: If the actual price level is lower
Q131: Workers usually negotiate compensation in terms of
Q133: The nominal cost per unit of output
Q137: If global pollution causes climatic changes that
Q138: An adverse supply shock would shift:
A)only the
Q141: The international oil price hike by OPEC
Q144: During a particular year,nominal wages increased by
Q150: An increase in the federal minimum wage
Unlock this Answer For Free Now!
View this answer and more for free by performing one of the following actions

Scan the QR code to install the App and get 2 free unlocks

Unlock quizzes for free by uploading documents