The figure given below depicts long run equilibrium in an aggregate demand-aggregate supply model. The change in real GDP in this figure from Y1 to Y2 could have been caused by: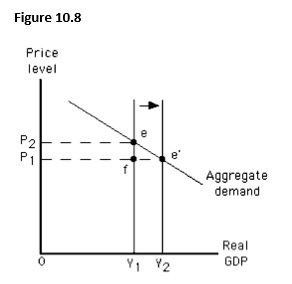
A) a government policy aimed at increasing demand.
B) a change in weather conditions that led to worldwide crop failures.
C) an attempt by key resource producers to monopolize supply.
D) an increase in taxation or a decrease in government spending.
E) an increase in labor productivity.
Correct Answer:
Verified
Q99: The figure below shows the determination of
Q100: The figure below shows the determination of
Q101: The figure given below depicts long run
Q102: Which of the following is most likely
Q103: The figure given below depicts long run
Q103: The main effect of a decrease in
Q108: Which of these is most likely to
Q115: Which of these is most likely to
Q118: In the long run,a leftward shift of
Q119: Which of these is not a beneficial
Unlock this Answer For Free Now!
View this answer and more for free by performing one of the following actions

Scan the QR code to install the App and get 2 free unlocks

Unlock quizzes for free by uploading documents