The Center for Disease Control has published statistics relating maternal smoking to low birth weight. The data follow in terms of the percentage of birth weights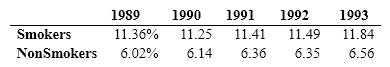
Which of the following ways of presenting the data would be most informative?
A) a histogram
B) a time series graph with a line for smokers and one for non-smokers
C) two pie charts
D) a stem-and-leaf display
Correct Answer:
Verified
Q14: On October 25, 1978 the Washington Post
Q15: "5s" represents what numbers on a stem-and-leaf
Q16: Frequency distributions are used
A) as a first
Q17: On a recent fundraising drive, most of
Q18: For the data referred to in the
Q20: When we plot a histogram, the values
Q21: Displaying data on graphs
A) can aid communication
Q22: In deciding on the number of stems
Q23: The real lower limit and the real
Q24: The following is a frequency distribution.
Unlock this Answer For Free Now!
View this answer and more for free by performing one of the following actions

Scan the QR code to install the App and get 2 free unlocks

Unlock quizzes for free by uploading documents