The graph that shows intrapleural pressure changes during normal spontaneous breathing is depicted by which of the following?
A) 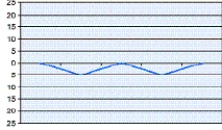
B) 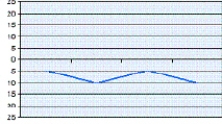
C) 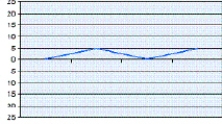
D) 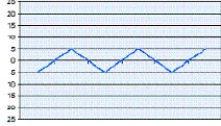
Correct Answer:
Verified
Q5: Based upon the following patient information,calculate the
Q6: The formula used for the calculation of
Q7: Calculate airway resistance (Rₐᴡ)for a ventilator patient,in
Q8: The body's mechanism for conducting air in
Q9: Which of the following are involved in
Q11: A patient receiving mechanical ventilation has
Q12: The patient-ventilator data over the past few
Q13: Which of the following conditions causes pulmonary
Q14: Calculate the pressure required to achieve a
Q15: During spontaneous inspiration alveolar pressure (PA)is about:
Unlock this Answer For Free Now!
View this answer and more for free by performing one of the following actions

Scan the QR code to install the App and get 2 free unlocks

Unlock quizzes for free by uploading documents