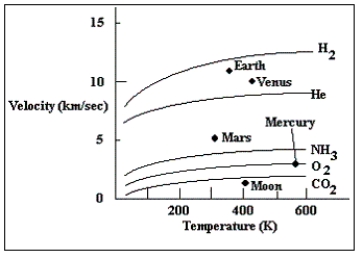
-The graph plots the escape velocity of several solar system objects along the vertical axis,and surface temperature along the horizontal.The lines plotted in the figure are the average speeds of gas particles as a function of temperature for various gases.Which of the objects plotted in this diagram has the highest escape velocity?
A) Mars
B) the Moon
C) Venus
D) Earth
Correct Answer:
Verified
Q48: Q49: Which of the following is one hypothesis Q50: What does the extremely large size of Q51: Which of the following is a very Q52: Which of the following planets has the Q54: Which of the answers below orders the Q55: What is a major difference between the Q56: In what way is Venus very different Q57: What is believed to be the origin Q58: Which of the following has the least![]()
Unlock this Answer For Free Now!
View this answer and more for free by performing one of the following actions

Scan the QR code to install the App and get 2 free unlocks

Unlock quizzes for free by uploading documents