For an ideal gas sample, the following graph could represent a plot of _____. 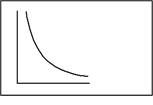
A) Boyle's law, V vs. T at a given constant P.
B) Charles's law, P vs. T at a given constant V.
C) Boyle's law, P vs. V at a given constant T.
D) Dalton's law, PV vs. P at a given constant T.
E) Avogadro's law, P vs. n at a constant T.
Correct Answer:
Verified
Q2: A sample of acetylene gas occupies a
Q3: A balloon contains 14.0 L of air
Q4: Which of these statements concerning pressure and
Q5: Which of these is not a possible
Q6: The layer of air that surrounds the
Q8: A sample of the gas Freon in
Q9: The unit of pressure is _.
A) kN/m2
B)
Q10: Which of these is the correct representation
Q11: What causes pressure?
A) A sudden decrease in
Q12: What is the correct conversion factor between
Unlock this Answer For Free Now!
View this answer and more for free by performing one of the following actions

Scan the QR code to install the App and get 2 free unlocks

Unlock quizzes for free by uploading documents