Multiple Choice
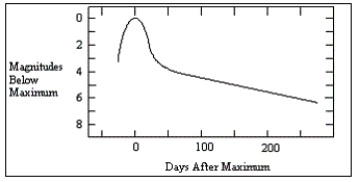
-The diagram shows a light curve from a supernova.How many days after maximum light did it take for the supernova to decrease in brightness by 5 magnitudes?
A) less than 50
B) 50
C) 150
D) 250
Correct Answer:
Verified
Related Questions
Q28: After they leave the main sequence,what happens
Q29: When does a type-II supernova occur?
A)when a
Q30: Which of the following is almost always
Q31: What is a planetary nebula?
A)the expelled outer
Q32: What produces synchrotron radiation?
A)objects with temperatures below
Q34: What does a planetary nebula do?
A)produces an
Unlock this Answer For Free Now!
View this answer and more for free by performing one of the following actions

Scan the QR code to install the App and get 2 free unlocks

Unlock quizzes for free by uploading documents