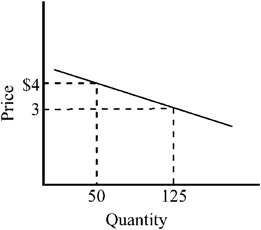
Figure 7-7 
In the price range between $3 and $4, the price elasticity of the demand curve depicted in Figure 7-7 is
A) highly elastic.
B) approximately equal to − 0.33.
C) approximately equal to − 3.
D) of unitary elasticity.
Correct Answer:
Verified
Q106: The difference between normal and inferior goods
Q114: When economists say the price elasticity of
Q125: A good with a high income elasticity
Q130: If the demand for a product increases
Q131: If the income elasticity of a good
Q140: If a 10 percent increase in income
Q140: If rice is an inferior good,
A) the
Unlock this Answer For Free Now!
View this answer and more for free by performing one of the following actions

Scan the QR code to install the App and get 2 free unlocks

Unlock quizzes for free by uploading documents