Figure 2-2 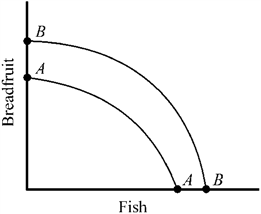
Which of the following would most likely cause the production possibilities curve for breadfruit and fish to shift outward from AA to BB in Figure 2-2?
A) a decrease in the labor force of the country
B) a sudden change in consumer preferences for more fish and less breadfruit
C) a major technological advance
D) a decrease in the capital stock
Correct Answer:
Verified
Q72: Even countries that depend primarily on market
Q74: When collective decision making is utilized to
Q177: Use the production possibilities data below for
Q179: Use the table below to choose the
Q181: Use the production possibilities data below to
Unlock this Answer For Free Now!
View this answer and more for free by performing one of the following actions

Scan the QR code to install the App and get 2 free unlocks

Unlock quizzes for free by uploading documents