Multiple Choice
Figure 8-2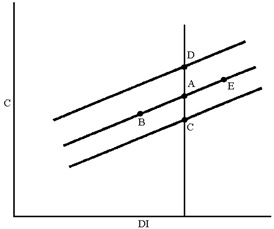
In Figure 8-2, which of the following moves can be explained by a decrease in the price level?
A) A to B
B) A to C
C) A to D
D) A to E
Correct Answer:
Verified
Related Questions
Q102: For each $1 of a tax cut,
Q104: Figure 8-1 Q108: Assume that consumption in the United States Q111: In Macronesia, the MPC is approximately 0.80.If Q113: Anna enters the workforce after being unemployed Q118: If the MPC is 0.80, then a Q119: Figure 8-2 Q120: A movement from one point to another Q122: Figure 8-2 Q139: If the price level increases, we would Unlock this Answer For Free Now! View this answer and more for free by performing one of the following actions Scan the QR code to install the App and get 2 free unlocks Unlock quizzes for free by uploading documents
![]()
![]()
![]()

